How a total is built: from a projected score to a line
Every total on the card starts life as a projected score. Before there is a line, and before there is a label, the model writes down how many points each team should score, adds the two numbers together, and that sum is the model total. The market has its own number, and when the two disagree by enough, a lean appears. This piece follows one number through those three steps, using real games from this week's feeds.
Step one: the projected score
In football the model starts from the league base — what an average pair of teams would score — then adjusts for the two teams in this game. Jacksonville at Baltimore, Nov 5, is the cleanest example this week. The league base was 46.0 points. Both offenses added 3.0. Both defenses subtracted 3.0. The quarterbacks and everything else added nothing. The sum is a model total of 46.0, built from a projected score of Jacksonville 26.5, Baltimore 19.5.
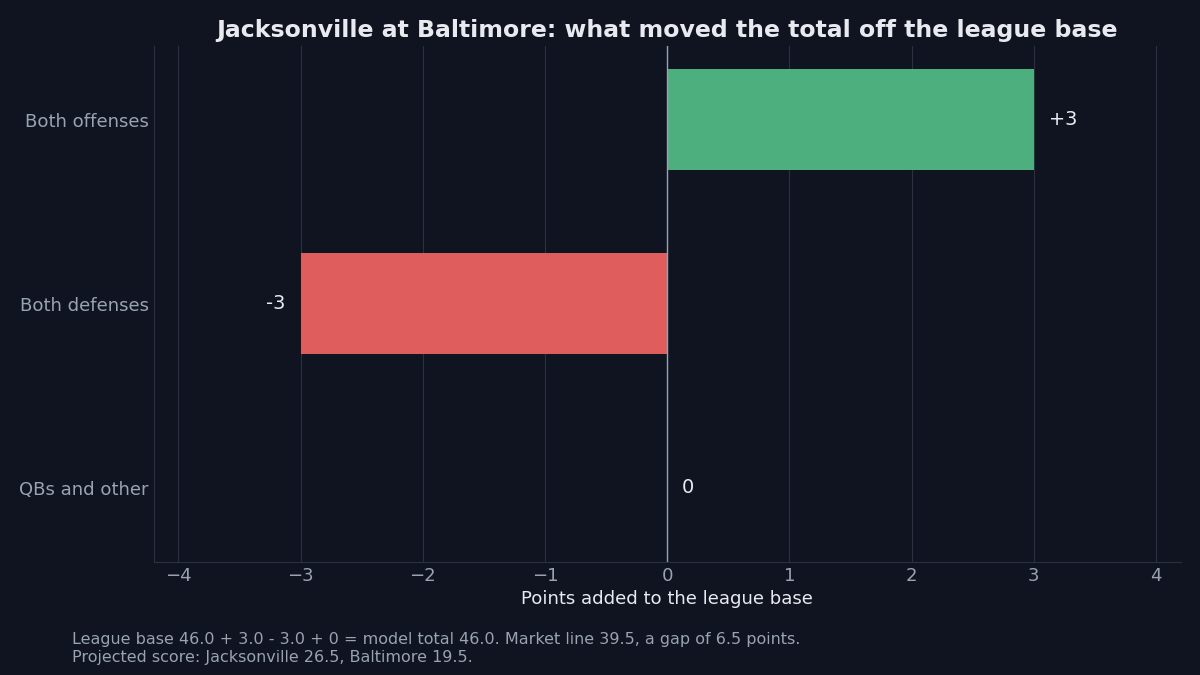
The market line for that game was 39.5, a gap of 6.5 points from the model total. That gap is what made Over 39.5 a strong lean at -110. The game finished 33-10, 43 points, and the lean won for +1.0u. Washington at New York, Nov 12, ran the same way on a smaller gap: a model total of 45.5, from a projected score of New York 23.5, Washington 22.0, against a market line of 40.5. Over 40.5 was a moderate lean at -115, and the game finished 24-21, 45 points, for +1.0u.
Two details from that second game are worth keeping. The market total fell from 42.5 to 40.5 during the week, while the model number never moved from 45.5: the model total is built from the teams, so it holds still unless the teams change, while the market total moves with money and news. And the model had the Giants by about 2 points — Washington won 24-21. The spread and the total are separate questions: the total comes from the projected score, not from who wins.
Step two: from a number to a chance
A model total is one number. A lean needs a chance, and the chance comes from the whole spread of possible scores around that number. Hockey shows this best, because the model publishes the chance of every possible total.
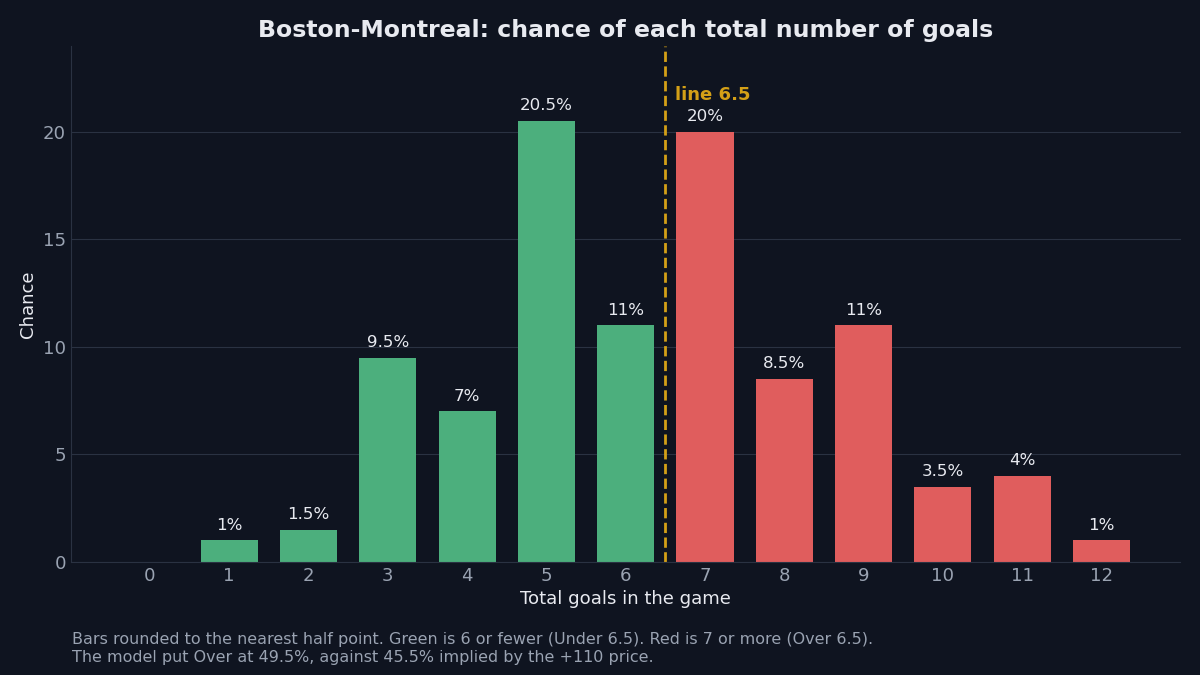
Boston against Montreal, Nov 12: the model projected about 3.5 goals for Boston and 3.0 for Montreal, a model total of 6.5. The market line was also 6.5. Same number, no gap at all — and Over 6.5 still carried a slight label at +110. The chart below is why. The model's chance of seven or more goals was 49.5%, while the +110 price charged for 45.5%. Five goals (20.5%) and seven goals (20.0%) were both more likely than six (11.0%), because a 3-3 game does not end 3-3: it goes to overtime and usually ends 4-3, so probability moves from six goals to seven. The game finished 2-5, seven goals, and the lean won for +1.0u.
The same step runs in the other direction. Toronto against Minnesota, Nov 12: the model total was 6.0 against a market line of 6.5, and Under 6.5 was a strong lean at -118, with the model putting Under at 62.5% against 51.5% implied by the price. The game went over 6.5, and the lean lost -1.0u. A strong label means a bigger gap between the model's chance and the market's, not a surer thing.
Step three: from a chance to a label
The label is a threshold on the gap between the model's chance and the market's. On hockey totals the bar is 3.0 points of edge for slight, 5.0 for moderate, 7.0 for strong. Boston-Montreal's edge was 3.5 points, so it was slight. Toronto-Minnesota's was 10.5 points, so it was strong. All five totals on the Nov 12 hockey card clear the bar in the same way: three won, two lost, for +0.5u on the night. The two losses carried the two biggest edges on the card, and the three wins included the slightest one. That is the normal shape of a night, not a surprise: a bigger edge means a bigger disagreement, and disagreements lose their share.
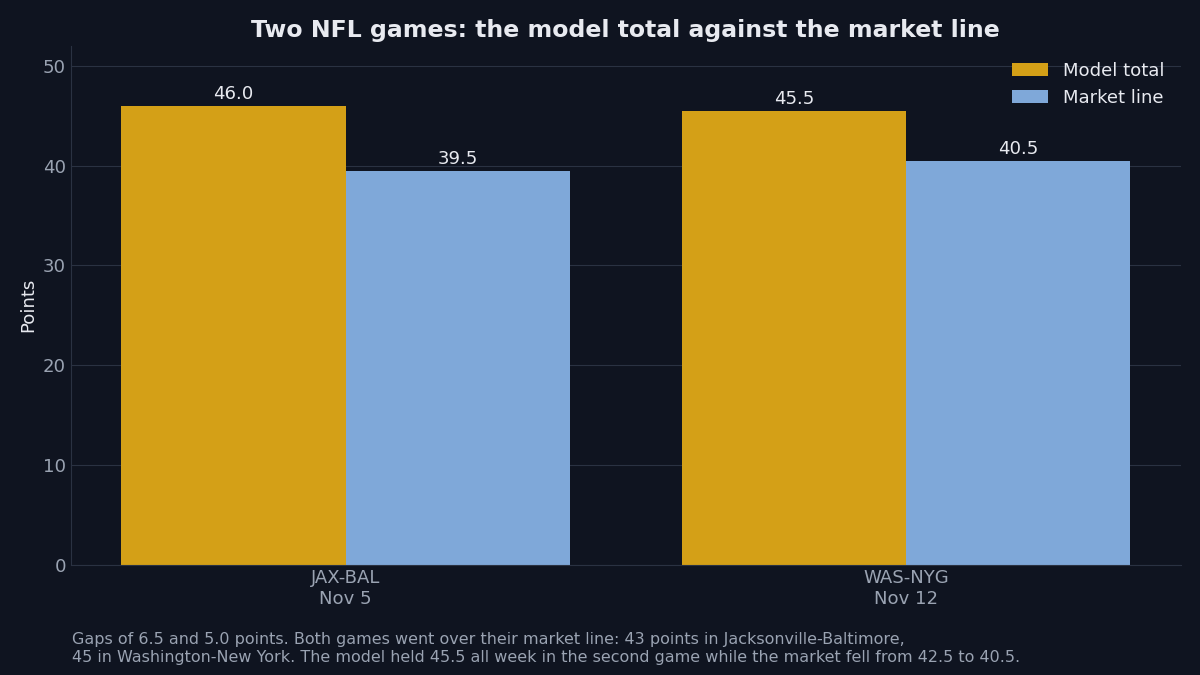
Football labels its totals differently: the label runs on the size of the gap between the two totals, not on the chance. Jacksonville-Baltimore's gap was 6.5 points, so Over was strong. Washington-New York's gap was 5.0 points, so Over was moderate. The chance can even run the other way: the model's chance of going over in Washington-New York was 50.5%, a shade below the 51.0% the market's price implied, and the lean was still moderate, because the label came from the 5.0-point gap. Two sports, two ways of turning the same disagreement into a label, and both are written down on the card before kickoff.
What the season says
Through Nov 12, on lock-graded rows only, hockey totals stand at 82-76 for +0.5u across 158 leans, and football totals at 34-34 for -3.5u across 68 leans. Of the three markets in each sport, totals have finished closest to even in both. That is the honest shape of this market: the model's totals are about as good as the market's, and the market's totals are the hardest number on the card to beat by much. A total lean is a disagreement about scoring, and scoring is the part of a game with the most ways to be wrong. The number is built carefully, the chance is counted honestly, and the label says how far apart the two numbers are. Nothing in the three steps says the game will cooperate.
21+. If gambling stops being fun, call 1-800-GAMBLER.